Wednesday, May 31, 2006

Augusta/Washington County Berrys Relationships

Dr. Colleen Fitzpatrick is certainly a nice person!   You will recall that she is the author of Forensic Genealogy, and co-author with Andrew Yeiser of DNA & Genealogy.

Trying to understand what the cladograms tell us about the relationships between 37 marker tested members of the Augusta/Washington Co. Berry family, I wrote her the following:
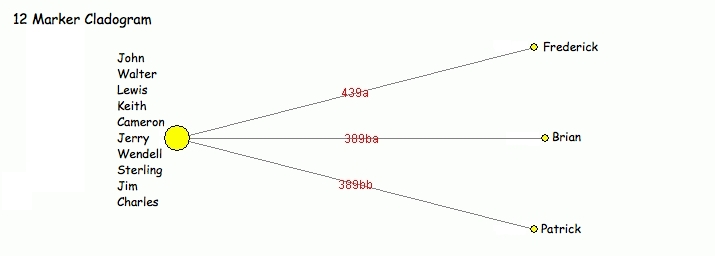
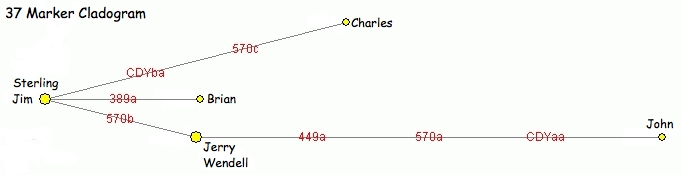
In the attached cladogram Sterling/Jim (2510) descend from the immigrant John, and Charles (2287) descends from the immigrant James.   We know that John and James were both born in Ireland, probably before 1700 but nothing more.   Both showed up in Virginia in the early 1700s.   We've always assumed that they were brothers, perhaps cousins or even uncle/nephew.   Jerry (3399) is a NPE who matches Wendell.   We do not have a paper connection for Wendell but they lived in close proximity to those previously mentioned in SW Virginia.   John Edw. is also not paper connected to elder James or elder John but is to Wendell.   Neither do we have a paper trail for Brian whose ancestor we can only trace back to Pennsylvania in the 1860s.

Are we able to guess anything more about the relationships of these parties, particularly elder James (2287) and elder John (2510), vis-a-vis the others?

Click cladogram to magnify image

Her responses follow, verbatim:
Please attach the word "probably" to everything below.

Well, first you can say that all these guys are closely related.   As far as where and when they are related:

            1) You can say that the mutations that separated (Jim & Sterling) from (Charles) happened in Ireland, since you know that (J&S) and Charles do not have a common ancestor in the US.

            2) Likewise, the mutation that separated (Jerry & Wendell) from John Edward happened in the US since I gather you know their common ancestor and he was in the US.

            3) At first glance it is up in the air whether the common ancestor between (Jerry & Wendell) and (Jim & Sterling) was in Ireland or was here.   But our guess was that he was in Ireland.   We reason this because the single mutation separating (J&W) from (J&S) on DYS 570 happened before the three mutations (CDY, 449, 570) that separate John Edward from (Jerry & Wendell).   Since three mutations would probably happen over a long period of time, they must have happened in the early history of the family in the 1700s, and therefore any previous mutation happened (and the common ancestor lived) back in Ireland.

As far as the relative ages of the haplotypes:

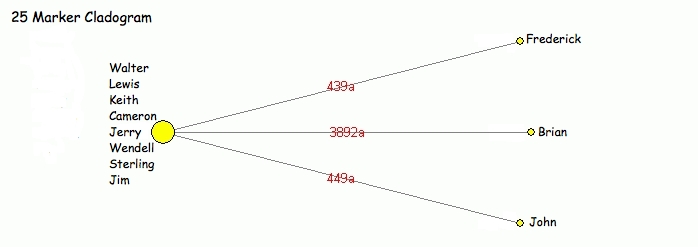
            1) The oldest haplotype of all is (Jim & Sterling)'s and the other branches are derived from them so that Jim and Sterling probably carry the haplotype of the common ancestor of this cluster.   As your study progresses, you may see this configuration change and another person take the center of the cluster, in which case this future person would have the haplotype of the ancestor.

The reason we designate (Jim and Sterling)'s haplotype as that of the ancestor is that their yellow circle has the most branches (each representing a different mutation) coming from it.   This means their haplotype has been in existence the longest, and has had the most time to mutate.

            2) The second oldest is (Jerry & Wendell)'s.   Starting with (Jim & Sterling) as the oldest means that Jerry and Wendell's haplotype was created by a mutation at DYS 570 on (J&S).   Once (J&W) came into being, it has had a chance to "sprout" once, creating John Edw' haplotype.

            3) There are three nodes that have not sprouted yet = John Edward, Brian, and Charles (a sprout does not counting their single connections to (Jim & Sterling) and (Jerry & Wendell) since these two haplotypes are older).   Normally, I'd say the two showing a two-step mismatch (Brian and Charles) occurred later than the one showing a three-step mismatch (John Edward).   But you know that John Edw has a common ancestor with Wendell in the US and Charles and (Jim & Sterling's) common ancestor had to be in Ireland.   So the chronology must be the other way around.

Having a three step difference between (Jerry & Wendell) and John Edward over about 300 years is not all that probable.   A calculation of the Most Recent Common Ancestor would put him many more generations back than this, with only about a 25% chance that the common ancestor lived within the last 300 yrs.   But it can happen.   I'd chalk this three step mismatch up to a fairly rare event (or a rare combination of single events) and say that since the connection between Charles and (Jim & Sterling) must be in Ireland, then the common ancestor between Brian and (Jim & Sterling) is in Ireland, too.

Our conclusions based on what you say about your paper trail are logical.   Our conclusions based on the number of mutations and their chronological order are based on a small number of haplotypes which is not a whole lot of data to go on.   So I'd say keep this all in mind and as you get more people into your study that fit into this group, don't be surprise if the configuration changes somewhat.

* * * Addendum * * *

Carol Vass correctly pointed out to me that I had misspoken about elder James' and elder John's descendants in my original question.   Therefore, hat in hand, I went back to Colleen with this correction:

In fact, according to the paper genealogy, only Jim (2510) descends from the immigrant John and both Charles (2287) and Sterling (2510) descend from the immigrant James.   Everything else I told you is correct.

Her reply:
The answer to your question is that since Charles and Sterling both descend from James and Jim descends from John, that both John and James had the same DNA profile and that later a line broke away from James' family with those two mutations (570 and CDYa) and that is the where Charles descends from.   This is kind of interesting because everyone who has those same mutations will be from that same line.   It's a way of differentiating it from the others.  .  .  .

Same thing happened with Jerry and Wendell's line.   Somewhere they had an ancestor who broke away from John and James' (mutual) genetic line with a single mutation at 570.   Anyone with this mutation is probably a descendent of that break-away ancestor.

It's curious to me that in both cases 570 is involved and that between Jerry and John Edward there is another mutation on CDYa.   As you add more members to your study, it will be interesting to see how the network develops in this corner.  .  .  .

Tuesday, May 30, 2006

Remember Decoration Day

Decoration Day was officially proclaimed on May 5, 1868 by General John Logan in his General Order No. 11 to honor the Union soldiers who died during the Civil War, and was first officially observed on May 30, 1868.

Since we invaded Iraq on March 20, 2003:

2470 U.S. service members killed.

18184 U.S. service members wounded.


"W" is still for War.

Thursday, May 25, 2006

* * * HIATUS * * *

Sorry to have gotten some of you just tuned in and then to have to tell you that I'll be off playing and listening to old time music at the Vandalia Gathering in Charleston, WV until midweek next week.

I won't have access to a computer to post anything -- and I'm not sure that I'd want to anyway.

A bit of news.   Carolyn "Cookie" Paulson, Administrator of this Project, has decided that she would like to 'retire'.   Without her having stepped forward in 2003 this Project would not have gotten started and we'd all be the poorer for it.   Her email address is on the Project website and if you'd like to drop her a short note of thanks I'm sure she would appreciate it.

On the good news side, Carol Vass has agreed to be co-administrator of the Project with me.   Many of you know Carol already.   She probably has a better grasp of Berry relationships, particularly Augusta/Washington County Berrys, than anyone I know.   She also thinks that DNA and cladograms are fun.

Tuesday, May 23, 2006

An Introduction to Cladistics

Cladistics is a particular method of hypothesizing relationships among organisms.   Like other methods, it has its own set of assumptions, procedures, and limitations.   Cladistics is now accepted as the best method available for phylogenetic analysis, for it provides an explicit and testable hypothesis of organismal relationships.

The basic idea behind cladistics is that members of a group share a common evolutionary history, and are "closely related," more so to members of the same group than to other organisms.   These groups are recognized by sharing unique features which were not present in distant ancestors.   These shared derived characteristics are called synapomorphies.

There are three basic assumptions in cladistics:
  1. Any group of organisms are related by descent from a common ancestor.
  2. There is a bifurcating pattern of cladogenesis.
  3. Change in characteristics occurs in lineages over time.
The final assumption, that characteristics of organisms change over time, is the most important assumption in cladistics.   It is only when characteristics change that we are able to recognize different lineages or groups.

The output from a phylogenetic analysis is a hypothesis of relationship of different taxa.   This hypothesis can be represented as a cladogram, a branching diagram.

The building of a cladogram includes these rules:
  • All taxa go on the endpoints of the cladogram, never at nodes.
  • All cladogram nodes must have a list of synapomorphies which are common to all taxa above the node (unless the character is later modified).
  • All synapomorphies appear on the cladogram only once unless the character state was derived separately by evolutionary parallelism.

Monday, May 22, 2006

The case for More Markers

This is a skeleton cladogram showing the relative positions of those Berrys tested at the 37 marker level, without the inclusion of the marker difference numbers.   It is my understanding that the line lengths themselves correspond to some extent to 'relatedness'.   To see the cladogram showing all the marker 'differences', click here.
Click cladogram to magnify image

At the 37 marker level we have approximately 20 participants testing including three family groups, the Benton Co. Berrys, the Orange Co., NC Berrys and the Augusta/Washington Berrys, shown above by the gold, red and purple boxes, respectively.

At the 37 marker level, there are at least two family groupings that we can begin to see splitting into their family lines and one not.   This is especially evident when we compare these cladograms with those 25 marker cladograms posted on May 19.
Click cladogram to magnify image

On the Main page, the family groups represented are the Orange Co., NC group and the Benton Co. group.   The Orange Co. group we can see splitting into families.   The Benton Co. Group, on the other hand, are grandfather, father and two sons, which we would not expect to see split.   It might be helpful to also refer to the 37 marker distance table as we examine these cladograms.


Click cladogram to magnify image

On the Stalk page we find seven members of the Augusta/Washington Co. Berrys who seem to have split into lines that are not exactly what we thought we knew or what we guessed from our paper trail.   It will be very interesting to see what the splits will be if these same people test to 66 markers.

Stay tuned.

Sunday, May 21, 2006

Upgrade paths, redux

Apparently without announcement, FTDNA has increased the scope of its latest upgrade from 59 markers to 66 markers, with no corresponding increase in price.    Amending my post of May 13, therefore, the new upgrade path is:

If starting with the 12-marker test kit at     $99
upgrade 12 to 25-marker additional *$49* (total $148)
then upgrade to 37-marker additional *$49* (total $197)
then upgrade to 66-marker additional *$99* (total $296)
-or-
upgrade 12 to 37-marker additional *$99* (total $198)
then upgrade to 66-marker additional *$99* (total $297)
-or-
upgrade 12 to 66-marker additional *$189* (total $288)
___________________________________

If starting with the 25-marker test kit at   $148
upgrade 25 to 37-marker additional *$49* (total $197)
then upgrade to 66-marker additional *$99* (total $296)
-or-
go from 25 to 66-marker additional *$148* (total $296)
____________________________________

If starting with the 37-marker test kit at    $189
then upgrade to 66-marker additional *$99* (total $288)
____________________________________

Or go directly to the 66-marker test kit at  $269
(a $19 to $28 savings)

All prices are FTDNA group rates -

Other choices? Click this ISOGG Chart.

Friday, May 19, 2006

Chapter 2. The Berry Cladogram

Well, this is really interesting!   Colleen has run cladograms for us of all Berrys in the Project who have tested to 25 markers.   You will recall that yesterday she told us that 12 markers provide only a limited idea of who might be related, that we really need 20 markers to establish if two people have a relationship and that as we compare more markers we can begin to see the different lines of closely related people.

Here's the 25 marker cladogram of the main grouping of our Berry DNA Project.   All these folks are haplogroup R1b1, either measured or estimated, except Brian Joe Lobley Berry and Keith Thomas Berry, both measured R1b1c, and shown at the bottom of the chart.

Click cladogram to magnify image

You will notice that a branch goes off to the right center and upward from the main group shown above.   These folks all turn out to be haplogroup I1a and are shown below.
Click cladogram to magnify image

These diagrams are a graphic representation of the relationships between the people shown.   The more recent the relationships the more closely individuals are shown on the cladogram.   As the relationships occurred in the more and more distant past the distances between the individuals become greater and greater.

Thursday, May 18, 2006

Cladograms & Phylogenetic Trees

I had the uncommon good fortune the other day to read a series of postings on the ISOGG list concerning the subject of this Post.   I had never understood what these things were.   They always seemed to me to be some sort of incomprehensible diagram of lines connecting cryptic letters and symbols.

Well, long story short, I contacted Colleen Fitzpatrick who offered to generate the diagrams for me if I furnished my data.   I thought that I knew our Augusta/Washington Berrys the best so felt that I might be better able to make sense of what I was seeing if I used the data from that family.

Dr. Fitzpatrick not only generated the cladograms for me, she sent them back with her assessment of what was being shown.   With her permission, the balance of the narration is hers.   I have changed 'identifiers' to names, for clarity.

Click cladogram to magnify image

12-marker clad
At this level, all you can say is that Frederick, Brian, and Patrick MIGHT represent different lines of the family.   The other ten people are identical and are represented by the large yellow circle to the left.   Because you really need about 20 markers to really establish if two people have a relationship, the 12 marker test provides only a limited idea of who might be related.   So since the names you are studying are pretty common (at least I think so), just because those three guys are separated by one marker from the main group doesn't necessarily mean they are related in the recent past.   In general my experience has been that if someone mismatches by even 1 marker on a 12-marker test, when he goes up to 25 markers, his mismatch will only increase.

Click cladogram to magnify image

25-marker clad
At this level, Frederick and Brian are still 1 mismatch away from the main group.   John has also now shown a mismatch and he has differentiated himself from the main group.   Each of these guys almost certainly represents a different line of the family, all related in the recent past.   The main group contains the other 9 identical haplotypes.

Click cladogram to magnify image

37 marker clad
John has really moved away from the center.   He is now separated by 3 markers from his nearest neighbor and by 4 markers from the main group.   This shows you the importance of testing on more markers.   Brian is still hanging in there at 1 mismatch. Charles has now broken away from the pack and now shows 2 mismatches.   (I guess Frederick did not test on 37 markers.)   There are two pairs of matching haplotypes now (Sterling and Jim) and (Jerry and Wendell).   The cladogram is forming a very nice star pattern. As you add more people, the star ought to develop more and longer rays, depending on how long the name has been in use by this particular group of people.

Some things to note:

1) The more markers the more spread out your cladogram gets.
2) The more markers the more likely someone will develop a mismatch and the more likely a large groups of identical haplotypes will break into several smaller groups (some maybe containing 1 individual).   This helps distinguish different family lines.

You can judge who is related in the "recent past" (say the last 200 yrs) and "remote past" (the last 500 yrs) to someone by drawing circles around that person in the diagram and seeing who falls within the circle.   I find it an easy way to interpret results rather than looking at a big array of numbers.

On p. 121 of our DNA & Genealogy book, we give a table of how far away (how many mismatches) someone can be and still be related to him in the recent and remote past.   We used FTDNA's average mutation rates for their marker panels to calculate the 50/50 probability of finding their most recent common ancestor within 200 yrs and 500 yrs.   Here are the results

Number of markers 12 25 37
Average Mutation Rate 0.00039 0.00044 0.00053
No. Mismatches (200 yrs) 0.08 1.25 2.42
No. Mismatches (500 yrs) 1.21 4.14 7.14

So for example on the 37 marker clad if you draw a circle around the group of Sterling and Jim of radius = 2.4, John (4 mismatches away) will be outside the circle, meaning he is probably not related within 200 yrs.   If you draw a circle with a radius 7.14, he falls within this circle, so he is probably related in the remote past (500 yrs).

NOTE: Dr. Fitzpatrick is author of Forensic Genealogy, and co-author with Andrew Yeiser of DNA & Genealogy.

Wednesday, May 17, 2006

mtDNA 101

Whether you are male or female, your mitochondrial DNA is inherited from your mother, who inherited her mtDNA from her mother, who inherited her mtDNA from her mother, ad infinitum (well, maybe not infinity, but at least ad nauseum).    It is passed from a mother to each of her children, male and female, but never inherited from the male, as illustrated by this Chart.

Thus, when you test your mtDNA you are testing your matrilineal ancestors (perhaps ancestresses?).   Corroborating such testing by traditional genealogy is considerably more difficult than corroborating your patrilineal ancestors, in part because of the surname change each generation, but also in part because of the legal status of women in many societies in the past and the fact that records were kept primarily by men for men.

mtDNA is tested on a sequence of two separate regions of the mitochondrion.   The first region is called Hyper-Variable Region 1 (HVR-1 or HVS-I), positions 16000 through 16569.   The second region is called Hyper-Variable Region 2 (HVR-2 or HVS-II), positions 1 though 575.   Most labs test some portion of either or both of these regions.   This result is then compared to a reference sequence, the Cambridge Reference Sequence, and any differences are reported.   Berry mtResults.   An exact match between two people indicates that they share a common ancestor.   However, since mtDNA mutates extremely slowly this common ancestor could have lived thousands of years ago.

The least expensive mtDNA test I have come across is offered by Argus BioSciences.   It tests the entire mitochondrial D-loop region which includes base pairs 16000 to 16569 and 00001 to 00575, a total of 1145 base pairs including the full hypervariable regions I & II, all for only $99 now $75.

Monday, May 15, 2006

Benton County Berrys

   - being the descendants of Samuel Berry/Nancy Crow.

The earliest known ancestor of this line is Samuel Berry whose estimated birth is circa 1775.   Samuel Berry married Nancy Crow 19 November 1795 in Washington County, Virginia.   This couple is believed to have moved to the area that became Carter County, Tennessee before 1800.   Samuel Berry was in Roane County, Tennessee as shown on the 1830 census and died there by October 1834.   Presumed children were: Robert Berry; James Berry; Samuel Berry; Thomas Berry; George Berry; William Lawson Berry; Elizabeth (Berry) Briggs; Henry Berry; Riece Berry and two more unidentified children.   Descendants of this line are found in Tennessee, Illinois, Arkansas, Texas, and Missouri.
   (Authored by Carol Vass & K. Waterhouse)

August 22, 2004

Proximity of this line, color coded Yellow, to other Berry lines may be seen by referring to these distance tables:
12 Marker Participant Distance Table.
25 Marker Participant Distance Table.
37 Marker Participant Distance Table.
Combined Marker Participant Distance Table.

Sunday, May 14, 2006

"W" is for War

Since we invaded Iraq on March 20, 2003:

2437 U.S. service members killed.

17869 U.S. service members wounded.

Happy Mother's Day.

Saturday, May 13, 2006

Upgrade paths.


If starting with the 12-marker test kit at $99
upgrade 12 to 25-marker additional *$49* (total $148)
then upgrade to 37-marker additional *$49* (total $197)
then upgrade to 59-marker additional *$99* (total $296)
-or-
upgrade 12 to 37-marker additional *$99* (total $198)
then upgrade to 59-marker additional *$99* (total $297)
-or-
upgrade 12 to 59-marker additional *$189* (total $288)
___________________________________

If starting with the 25-marker test kit at $148
upgrade 25 to 37-marker additional *$49* (total $197)
then upgrade to 59-marker additional *$99* (total $296)
-or-
go from 25 to 59-marker additional *$148* (total $296)
____________________________________

If starting with the 37-marker test kit at $189
then upgrade to 59-marker additional *$99* (total $288)
____________________________________

Or go directly to the 59-marker test kit at $269
(a $19 to $28 savings)

All prices are FTDNA group rates -

Other choices? Click this ISOGG Chart.

Friday, May 12, 2006

Sorenson -

Haven't tested yet? Read this! You should certainly consider the free test offered by Sorenson Molecular Genealogy Foundation (SMGF). In addition to the benefits of testing with Sorenson itself, as best I can find this is also the most economical route to a commercial lab test of a significant number of markers. When you submit your Sorenson test they give you a coupon with which you can obtain a discounted 26 marker Y-DNA test from Relative Genetics for $95. Click 'Other Tests' for more information.

Thursday, May 11, 2006

Project Update -

To get this started I thought maybe a Project Update might be in order. As many of you know, we began this Project in July of 2003. In just under three years we have 64 Y-DNA members, 2 mtDNA members plus two of our Y-DNA members have also done their mtDNA.

Of our 64 Y-DNA members, we have results back for 62 and they represent 39 separate and unrelated to one another Berry families.

Our largest group is the 'Augusta/Washington Co. Berrys' with 13 members. I have included our 2 'probables' (12 marker tests) in that number, I'm sure hopefully. 'Hopefully' because these are our two overseas members whose ancestors travelled from Ireland to Canada and Australia some 100 years later than those we know of for the stateside Berrys.

Our next largest group is the 'Benton Co. Berrys', being the descendants of Samuel Berry/Nancy Crow, with 7 members, followed by the 'Orange Co., NC Berrys' with 5 members, including one 'probable'. Then the 'Berry Plain Berrys' with 4 members, the 'Culpeper Co., VA Berrys' with 3 members, the 'Spartenburg Co., SC Berrys' with 2 members and the 'Berry/Faires Berrys' with 2 members.

We've had a couple of 'disappointments' and a few surprises. Surprises are nicer but disappointments enable us to focus our efforts where they will be more productive instead of continuuing to try to prove a relationship that doesn't exist.