Thursday, May 18, 2006
Cladograms & Phylogenetic Trees
I had the uncommon good fortune the other day to read a series of postings on the ISOGG list concerning the subject of this Post. I had never understood what these things were. They always seemed to me to be some sort of incomprehensible diagram of lines connecting cryptic letters and symbols.
Well, long story short, I contacted Colleen Fitzpatrick who offered to generate the diagrams for me if I furnished my data. I thought that I knew our Augusta/Washington Berrys the best so felt that I might be better able to make sense of what I was seeing if I used the data from that family.
Dr. Fitzpatrick not only generated the cladograms for me, she sent them back with her assessment of what was being shown. With her permission, the balance of the narration is hers. I have changed 'identifiers' to names, for clarity.
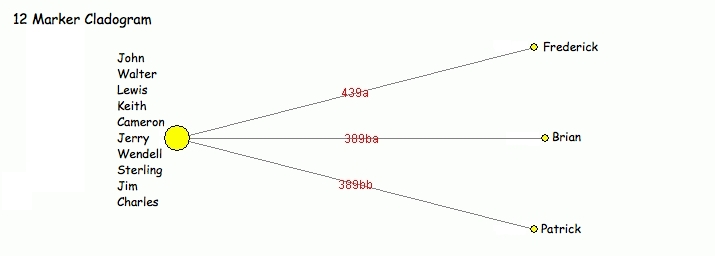
12-marker clad
At this level, all you can say is that Frederick, Brian, and Patrick MIGHT represent different lines of the family. The other ten people are identical and are represented by the large yellow circle to the left. Because you really need about 20 markers to really establish if two people have a relationship, the 12 marker test provides only a limited idea of who might be related. So since the names you are studying are pretty common (at least I think so), just because those three guys are separated by one marker from the main group doesn't necessarily mean they are related in the recent past. In general my experience has been that if someone mismatches by even 1 marker on a 12-marker test, when he goes up to 25 markers, his mismatch will only increase.
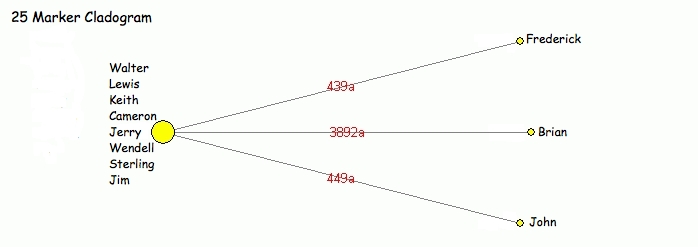
25-marker clad
At this level, Frederick and Brian are still 1 mismatch away from the main group. John has also now shown a mismatch and he has differentiated himself from the main group. Each of these guys almost certainly represents a different line of the family, all related in the recent past. The main group contains the other 9 identical haplotypes.
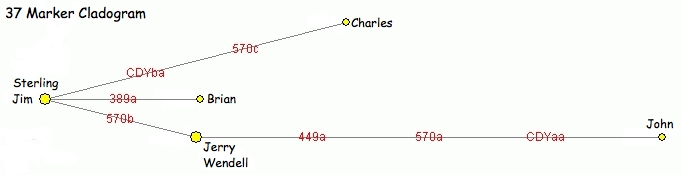
37 marker clad
John has really moved away from the center. He is now separated by 3 markers from his nearest neighbor and by 4 markers from the main group. This shows you the importance of testing on more markers. Brian is still hanging in there at 1 mismatch. Charles has now broken away from the pack and now shows 2 mismatches. (I guess Frederick did not test on 37 markers.) There are two pairs of matching haplotypes now (Sterling and Jim) and (Jerry and Wendell). The cladogram is forming a very nice star pattern. As you add more people, the star ought to develop more and longer rays, depending on how long the name has been in use by this particular group of people.
Some things to note:
1) The more markers the more spread out your cladogram gets.
2) The more markers the more likely someone will develop a mismatch and the more likely a large groups of identical haplotypes will break into several smaller groups (some maybe containing 1 individual). This helps distinguish different family lines.
You can judge who is related in the "recent past" (say the last 200 yrs) and "remote past" (the last 500 yrs) to someone by drawing circles around that person in the diagram and seeing who falls within the circle. I find it an easy way to interpret results rather than looking at a big array of numbers.
On p. 121 of our DNA & Genealogy book, we give a table of how far away (how many mismatches) someone can be and still be related to him in the recent and remote past. We used FTDNA's average mutation rates for their marker panels to calculate the 50/50 probability of finding their most recent common ancestor within 200 yrs and 500 yrs. Here are the results
Number of markers                12          25         37
Average Mutation Rate          0.00039     0.00044    0.00053
No. Mismatches (200 yrs)       0.08        1.25       2.42
No. Mismatches (500 yrs)       1.21        4.14       7.14
So for example on the 37 marker clad if you draw a circle around the group of Sterling and Jim of radius = 2.4, John (4 mismatches away) will be outside the circle, meaning he is probably not related within 200 yrs. If you draw a circle with a radius 7.14, he falls within this circle, so he is probably related in the remote past (500 yrs).
NOTE: Dr. Fitzpatrick is author of Forensic Genealogy, and co-author with Andrew Yeiser of DNA & Genealogy.
posted by langolier at 3:41 PM
![]()

0 Comments:
Post a Comment
<< Home