Friday, May 19, 2006
Chapter 2. The Berry Cladogram
Well, this is really interesting! Colleen has run cladograms for us of all Berrys in the Project who have tested to 25 markers. You will recall that yesterday she told us that 12 markers provide only a limited idea of who might be related, that we really need 20 markers to establish if two people have a relationship and that as we compare more markers we can begin to see the different lines of closely related people.
Here's the 25 marker cladogram of the main grouping of our Berry DNA Project. All these folks are haplogroup R1b1, either measured or estimated, except Brian Joe Lobley Berry and Keith Thomas Berry, both measured R1b1c, and shown at the bottom of the chart.
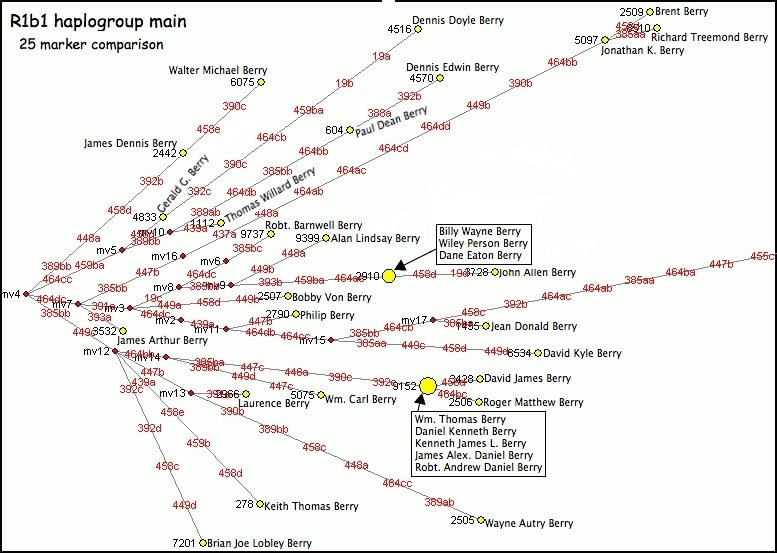
You will notice that a branch goes off to the right center and upward from the main group shown above. These folks all turn out to be haplogroup I1a and are shown below.
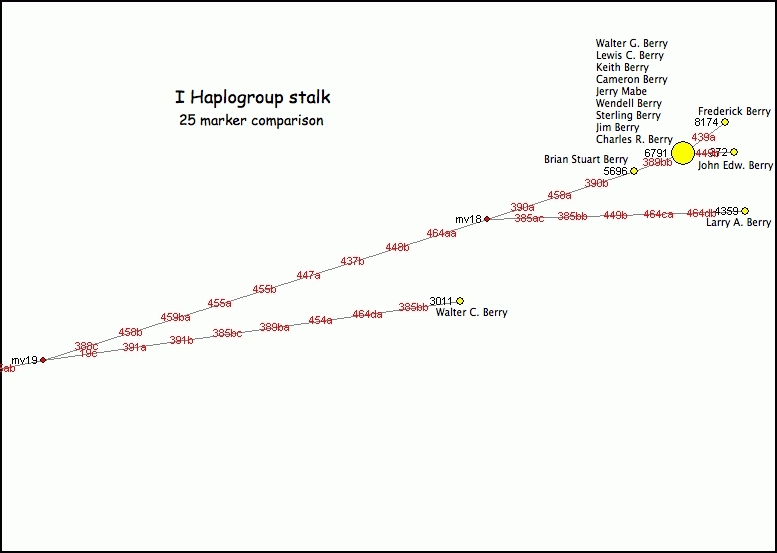
These diagrams are a graphic representation of the relationships between the people shown. The more recent the relationships the more closely individuals are shown on the cladogram. As the relationships occurred in the more and more distant past the distances between the individuals become greater and greater.
posted by langolier at 9:15 PM
![]()

0 Comments:
Post a Comment
<< Home